Gráficos y análisis del Lemming

miércoles, 29 de febrero de 2012

Sospechosos habituales

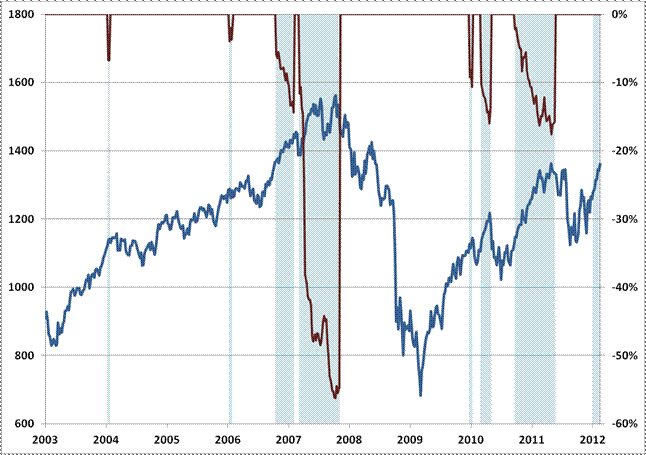
Buen artículo de Bradford DeLong en ProjectSyndicate

"(...)  Pero la situación hoy en día no es en lo absoluto habitual. Hoy la economía mundial está, como hace hincapié Ricardo Cabellero, del MIT, desesperadamente carente de activos seguros. Los inversionistas de todo el mundo están dispuestos a pagar precios extraordinariamente altos por deuda de economías centrales y aceptar tasas de interés muy bajas por ella, ya que valoran como un beneficio extraordinario el poseer un activo seguro que pueden utilizar como garantía.
En este momento, la preferencia de los inversionistas por la seguridad hace que la financiación de la deuda pública adicional sea anormalmente barata, mientras que las sombras de largo plazo proyectadas por la prolongada situación de anormalidad de la producción y el empleo vuelven costosa la lenta recuperación actual. Teniendo en cuenta la necesidad de movilizar recursos inactivos en el corto plazo con el fin de mantener el potencial productivo en el largo plazo, un mayor nivel de deuda sería, como expresara Alexander Hamilton, el primer secretario del Tesoro de EE.UU., una bendición nacional."

Sobre LTROs y círculos viciosos

Con el resultado de la subasta de liquidez a 3 años del BCE (LTRO) ya hay un BILLÓN de euros "extra" en el Eurosistema. ¿Será suficientes para desconectar esta circularidad?


El multiplicador y las subastas de liquidez del BCE: más allá de los precios relativos del colateral (caída de TIR en deuda pública), sin impacto –de momento- en el agregado de crédito.

martes, 28 de febrero de 2012

De la infra a la sobrevaloración y viceversa

El fuerte rally del grueso de activos de riesgo en las primeras semanas del ejercicio está provocando importantes desplazamientos en los niveles de valoración relativa de diferentes asset class.
page2image7424
Así, después de (1) los más de 100pb de relajación en el universo de high yield, (2) los 60pb de caída en TIR de investment grade con ampliaciones entre emisores núcleo o periferia, o (3) la expansión de PER en la que se ha apoyado el rebote en Bolsa (de 8,9x a 10,6x), analizamos en qué punto del ciclo de valoración táctico se encuentra cada alternativa de inversión.


Encontramos que:

El árbol de decisión de la reestructuración griega


Desde BofA (vía Zerohedge):

lunes, 27 de febrero de 2012

Los colores del EuroStoxx 50

Cinco variables a tener en cuenta:
  1. Beneficios: ratio entre el número re revisiones al alza y número de revisiones a la baja. Por encima de 1, earnings momentum positivo (verde).
  2. Valoración: análisis del PER y Precio / Valor Contable. Cuanto más bajo, más barato (verde).
  3. RPD = Rentabilidad por Dividendo
  4. Potencial: atendiendo a la mediana del precio objetivo del conseno de analistas.
  5. Beta: sensibilidad de la acción a movimientos del EuroStoxx 50

Atención esta semana al ISM en EEUU... y la reacción del S&P 500

El índice S&P 500 establece máximos de ciclo desde los mínimos de 2009, apoyado por una agenda de indicadores de coyuntura sólida y que ha reducido las probabilidades de recaída en 1T12.
Con todo, la lectura de la posición en el ciclo que subyace de un S&P 500 a las puertas de los 1.400 puntos debe ser confirmada por un ISM en niveles de 60. Si no hay esta confirmación el mercado de acciones podría corregir a corto plazo. Decidimos reducir peso en cartera a RV EEUU y establecer una posición neutral.

Impacto de la subida del crudo sobre el crecimiento económico

Buen gráfico resumen de JP Morgan

Actualizamos la respuesta a ¿cómo está el ciclo de beneficios?

En la tabla del margen derecho (preguntas de todos los meses), la respuesta y evolución.

domingo, 26 de febrero de 2012

The real mega bears...

El Dow Jones hizo crack en 1929...
El Nikkei colapsó en 1989...
Y el S&P 500 en el año 2000
Caminos (en términos reales o ajustados por inflación) desde el pico de los tres grande ciclos bajistas
¿El S&P 500 se comienza a desmarcar o cogiendo "carrerilla" para unirse a Nikkei y DJ? 


Resiste a la manada, valora solo los números

Jeremy Grantham:


Resist the crowd: cherish numbers only. We can agree that in real life as opposed to theoretical life, this is the hardest advice to take: the enthusiasm of a crowd is hard to resist. Watching neighbors get rich at the end of a bubble while you sit it out patiently is pure torture. The best way to resist is to do your own simple measurements of value, or find a reliable source (and check their calculations from time to time). Then hero-worship the numbers and try to ignore everything else. Ignore especially short-term news: the ebb and flow of economic and political news is irrelevant. Stock values are based on their entire future value of dividends and earnings going out many decades into the future. Shorter-term economic dips have no appreciable long-term effect on individual companies, let alone the broad asset classes that you should concentrate on. Leave those complexities to the professionals, who will on average lose money trying to decipher them.
Remember too that for those great opportunities to avoid pain or make money – the only investment opportunities that really matter – the numbers are almost shockingly obvious: compared to a long-term average of 15 times earnings, the 1929 market peaked at 21 times, but the 2000 S&P 500 tech bubble peaked at 35 times! Conversely, the low in 1982 was under 8 times. This is not about complicated math! 

    Dos cartas obligatorias para todo inversor / analista...

    El sr Buffet y el sr Grantham nos deleitan con un discurso fresco, alejado de ruidos, del "sell side", y con el aval que solo se gana con la experiencia de sobrevivir a varios ciclos en mercados financieros y realidades económicas...
    A disfrutar!

    sábado, 25 de febrero de 2012

    El ritmo insostenible y los primeros rezagados: el IBEX 35

    La RV Mundial: enero +4,4%, febrero +5,2%... un ritmo anualizado del 60%! Insostenible. El estímulo monetario y la recuperación de los indicadores adelantados de ciclo están situando el ritmo del rebote en niveles muy exigentes. En este contexto, monitorizamos regiones (gráfico) donde el earnings momentum no es lo suficientemente positivo para dar soporte a cotizaciones una vez se diluya el entorno de liquidez ultra expansivo. Alertas en: IBEX, Kospi, Portugal, China y Dow Jones. 


    viernes, 24 de febrero de 2012

    ¿También recesión en EEUU?

    A pesar del buen tono de los últimos indicadores adelantados en EEUU, hay analistas que todavía apuntan a una elevada probabilidad de recesión en la región. Entre ellos Lakshman Achunthan, director gerente del ECRI (Economic Cycle Research Institute).
    Achunthan acaparó muchos titulares el pasado mes de septiembre al publicar un informe que apuntaba que la recesión en EEUU "Está justo en el inicio, o enfrente de nosotros. Pero esto es sólo un pequeño detalle en estos momentos. Lo crítico de la noticia es que no hay marcha atrás. Vamos hacia una nueva recesión".
    Desde entonces, el giro de muchos indicadores adelantados, la estabilización del mercado laboral o la recuperación del consumo privado han dejado en una situación muy delicada a la inminente "call recession" del ECRI.
    Esta semana Achuntan ha vuelto para dar la cara y ¿reafirmarse en su alerta de recesión?

    El precio del crudo (Brent) en máximos históricos, en euros.

    La combinación de tensiones geopolíticas con un USD/EUR en niveles de 1,33 ha elevado el precio del Brent en euros por encima de los máximos de 2008. Dos efectos a tener en cuenta:
    1. Inflación: no es un problema a corto plazo. El efecto base de 2011 (precios altos del crudo) debería amortiguar las presiones sobre la estabilidad de precios en las lecturas generales de IPC.
    2. Crecimiento: la traslación del crudo a precios de la gasolina (máximos) y su impacto sobre la renta bruta disponible sí es un factor a tener en cuenta a corto plazo.

    jueves, 23 de febrero de 2012

    ¿Qué sugieren los indicadores adelantados? Menos contracción, más dispersión, más pendiente en curva ALE y apenas upside en bolsa

    Desde Analistas Financieros Internacionales

    El mercado arrancará la esperanza de los inversores y la comerá delante de sus ojos. Entonces comenzará un mercado alcista estructural (frente al bajista estructural que tenemos entre manos actualmente)

    Albert Edwards habla:


    "Una lección clave de Japón: el final de mercado bajista se alcanza con la pérdida de esperanza. Es cuando "los compradores en corrección" se convierten en "vendedores durante rebotes". Es cuando se seca el volumen hasta casi nada. Es la pérdida de la esperanza. 
    En Japón hemos visto recuperaciones enormes del Nikkei apoyadas por recuperaciones de ciclo que nunca llegaron a ser duraderas. Cada fracaso cíclico vino acompañado por nuevos mínimos en el mercado de renta variable. 
     
    El mercado está de nuevo en una fase de esperanza. 


    • La esperanza de que los EE.UU. se encuentra ahora en una recuperación autosostenible
    • con la esperanza de que China podría experimentar un aterrizaje suave
    • con la esperanza de que el rescate de Grecia y de las políticas de liquidez del BCE se han asentado las cosas en la zona del euro. 


    Estas ráfagas de esperanza son esenciales en los mercados bajistas de largo plazo y sus rebotes. Pero el mercado va a arrancar esa esperanza y la comerá delante de los ojos de los inversores. Sólo entonces comenzará un mercado alcista de largo plazo."


    Vía ZeroHedge

    miércoles, 22 de febrero de 2012

    ¿Por qué la Renta Variable lo ha hecho tan mal en la última década?

    ¿Y qué cabría esperar para los próximos 10 años?


    Desde Crestmont Research


    Para los teóricos de Dow

    Desde Bespoke:

    Dow Transports Diverge From Industrials

    Dow Theorists look for the Dow Jones Industrial Average (DJIA) and the Dow Jones Transportation Average to confirm each other. That means that when one index makes a new high, the other should be making a new high as well. When there is divergence between the two, as there is now, it could signal a trend reversal for the market.
    As shown below, the Dow Jones Industrial Average has been making new highs in recent weeks, while the Transports index has been struggling. The Transports index is having a tough time even holding onto its 50-day moving average, while the DJIA remains overbought. Time will tell how this plays out, but rest assured that we'll be hearing more and more about this negative divergence in the coming days.


    martes, 21 de febrero de 2012

    Elevated Markets and Drawdown Risks (Hussman)

    Interesante gráfico en el comentario semanal de Hussman Funds (aquí)

    "Elevated Markets and Drawdown Risks"

    "The chart below identifies periods in recent years where we reported market conditions as being at least "overvalued" and "overbought" in these weekly commentaries. Those two conditions alone aren't enough, by themselves, to put the market in a "hard-negative" situation, but even those two tend to be enough to invite drawdown risk. The overvalued, overbought periods are shaded in blue on the chart below. The red lines indicate the deepest drawdown experienced by the market over the following 18 months (right scale), while the blue line charts the S&P 500 (left scale). Notably, even with weakly negative conditions - overvalued and overbought - the market has typically moved lower at some point in the next 18 months, wiping out all intervening gains. That surrender of intervening gains usually begins with a very hard and unexpected initial loss that takes out the bulk of upside progress within a period of a few days or weeks. This is a general pattern that we also see throughout market history."

    domingo, 19 de febrero de 2012

    El megáfono del Dow Jones....¿hasta 15.000 y luego a 8.000?

    Patrón técnico con objetivo alcista en 15.000 puntos (2012-2013)... y posterior crash del 50%....
    El informe completo, aquí


    PIB España 4T11: -0,3% T. Cifras y Análisis

    Cifras y análisis (Afi):


    • Caída en tres décimas del PIB español en el 4T11 (Demanda Nacional -1,7% Demanda Externa +1,4% = -0,3%).  

    sábado, 18 de febrero de 2012

    Caution: Danger Ahead (Robert Rodriguez, First Pacific Advisors)

    By Robert L. Rodriguez, CFA
    Managing Partner and CEO

    ¿De la Argentina a Atenas? Mohamed A. El-Erian

    Desde Project Syndicate:


    Fijemos la escena: un enfoque de política económica cada vez más desacreditado da lugar a una creciente oposición social y política, protestas callejeras y violencia, desacuerdos entre los acreedores oficiales y una creciente preocupación entre los acreedores privados sobre la posibilidad de un impago caótico. En medio de todo esto, las autoridades se comprometen a más de las mismas duras medidas de austeridad que han sido incapaces de poner en práctica durante dos años. Los acreedores oficiales expresan su escepticismo, en privado y en público, pero se tapan las narices y se preparan para desembolsar otro paquete de ayuda en lo que temen sea un pozo sin fondo.
    ¿Suena familiar? Debería, pero no sólo porque se refiere a Grecia hoy en día. También es lo que la Argentina enfrentó en 2001. A menos que Europa reflexione sobre las principales lecciones de esa experiencia, los paralelos que se extienden a Grecia también pueden llegar a incluir una catástrofe financiera, un profundo colapso de la producción, y agitación social y política.

    China, la madre de todas las burbujas

    A tener en cuenta esta entrevista de Peter Chiappinelli (de GMO)

    “The firm is currently hedging its China exposure to near zero in the emerging-markets sleeves of its mutual funds, he said. The company has also taken a net short position on China in the hedge fund it operates.
    The problem Mr. Chiappinelli sees is that there’s going to be no easy way out of the bubble that exists in China’s infrastructure and real estate.
    “China is experiencing the mother of all bubbles,” he said today at the Bloomberg Portfolio Manager Mash-up in New York. “We don’t know when it’s going to pop or what’s going to cause it to pop, but there’s very little track record of countries successfully navigating a soft landing out of a bubble,” he said.”

    viernes, 17 de febrero de 2012

    Las probabilidades de un default desordenado en Grecia están subiendo

    Desde Credit Suisse...

    "We are cautious about reports of the exchange “running out of time”: the 20 March binding constraint is a GGB maturity. Greece is sovereign and has run out of money; it can choose the timetable. The case might be different if the maturity were an English law bond (but perhaps not much.)

    The real issue remains the ECB’s exposure to the BoG, in our view. Protecting that (i.e., ensuring that Greece does not systematically default via introducing a new currency) becomes the bottom line, as the latest Flash explored.

    jueves, 16 de febrero de 2012

    Las posiciones cortas y el sector bancario

    Desde Afi,


    "(...)Tanto en la caída hasta mínimos como en la posterior recuperación, el papel de las posiciones cortas ha sido, cuanto menos, secundario. Las apertura de swaps en dólares del BCE y los nuevos esquemas de liquidez, las ampliaciones de capital y el riesgo regulatorio, las propuestas de reforma del sector, el desapalancamiento del sector privado, incluido el financiero, las implicaciones sobre las expectativas de rentabilidad  a largo plazo, son, entre otras variables, las que en última instancia marcan la dirección de las cotizaciones del sector. Y, al margen de la mayor flexibilidad del BCE, el signo negativo en el resto de variables que hemos señalado tiene el suficiente peso específico para provocar caídas en cotizaciones (...)"


    "(...) cuando analizamos la evolución de los principales bancos europeos afectados por la prohibición de cortos en agosto (gráfico inferior) observamos que:

    1. El sector bancario español hizo mínimos en noviembre (-6% desde agosto)
    2. El sector francés también alcanzó mínimos en noviembre (-35% desde la prohibición)
    3. La banca italiana marcó mínimos en enero (un 21% por debajo de los niveles de cotización de agosto). (...)"


    Demografía, múltiplos en Bolsa y precio de los Bonos

    Una interesante reflexión de Credit Suisse (vía Zerohedge)


    The long-term link between demographic supply-demand shifts and the dynamics of asset price changes is hard to quantitatively dismiss and while it is just as difficult to trade these long-term shifts, as Credit Suisse notes, it is a useful context for considering tactical and strategic asset allocation. Based on projections of two interesting ratios (Middle-/Old-age ratio for equity multiples and Yuppie/Nerd ratio for bond yields), they find that US and European equity P/E multiples are set to structurally fall for the next decade (while Japan may see expansion) and similarly Japan is expected to see bond yields continue to structurally fall while US and European yields will rise (with US yields rising only modestly - though still painfully for governments - and UK quite significantly). While, of course, significant differences exist in the equity and debt market participation level and demand and supply mechanics of foreign investors, the relationships have stood the test of time and should warrant concern for the medium-term in both US and European markets as perhaps monetary policy's extreme experimentation is fundamentally fighting these trends that are exaggerated in the short-term by the cyclical-to-secular end of the leverage super-cycle.


    Dow Jones 10.000


    Last week, I asked the question “Where Are the Bears?.” I was quoting technician Helene Meisler, who had pointed out that many of the more well known bears had flipped bullish as markets approached multi-year highs.
    Amongst the few bears remaining, we can add famed Dow Theorist Richard Russell. The octogenarian wrote the following late Wednesday:
    “The worst kind of market is a market that goes down on good news. As I write, optimism is in the air, and the Dow is down 95 points. Dow 10,000 continues to be the great psychological barrier and my work suggests that that Dow 10,000 will be tested in the next few months. Therefore the operative word is caution. Keep the word caution in you conscious unconscious mind.”

    My only quibble is “What good news?” There has been soft earnings, mixed economic reports, and continued worries in the EU Zone.

    Regardless, Russell still likes gold, pointing out it “holds valiantly in the 1700s.” He adds “Something big is in the wind, and the stock market senses it.”
    My perspective is a bit different. Markets have rallied hard to start the year, and have been pulling back on lighter volume. That sort of back & fill is what we typically want to see in healthy markets.
    There is still plenty to be concerned about — Sentiment is frothy, the never-ending Greek saga is nettlesome, and earnings are near a cyclical peak.
    Regardless, Russell has been around a long time and has a decent track record.

    miércoles, 15 de febrero de 2012

    La cuadratura del círculo

    Los vértices del cuadrado:

    1. USD/EUR
    2. Cotizaciones Bancos
    3. Relación crédito vs bolsa
    4. Riesgo soberano periférico.
    Las direcciones del círculo
    1. Virtuoso (risk on): apreciación EUR + subidas bolsa + relajaciones TIR deuda periférica + relajaciones en diferenciales crédito
    2. Vicioso (risk off): apreciación USD + caídas bolsa + subidas primas de riesgo periféricas + tensiones mercado de crédito.
    Desde Analistas Financieros Internacionales resumen (i) la situación de los vértices y (ii) la dirección del círculo.

    "Analizamos la situación actual, desde un ángulo técnico, de cuatro monitores de mercado para evaluar la posibilidad de una pausa/giro en la actual dinámica (recuperación generalizada de cotizaciones). A destacar:


    • Curva deuda ESP (10y): apoyo de TIR en zona de soporte del rango lateral. Las divergencias alcistas en MACD abren un primer objetivo en el 5,5%.
    • Sector bancario del EuroStoxx (Bolsa): el rebote de 2012, avalado por las divergencias alcistas de 4T11, llega a zona de resistencias mayores (media de 200 sesiones). El riesgo de toma de beneficios en estos niveles se incrementa ante el cruce en MACD diario (gráfico).
    • Lectura crédito vs Bolsa: el iTraxx de financieros (medida de riesgo de crédito) se gira y deja de apoyar a las subidas de las cotizaciones en Bolsa. Riesgo de convergencia a la baja (caídas en Bolsa + ampliaciones de iTraxx).
    • USD/EUR: zona de congestión de resistencias en 1,31-1,33 (gráfico). La sobrecompra en RSI y MACD apoyan un escenario apreciador para USD (con objetivo en 1,25)"


    El que marca la dirección en Bolsa...en zona crítica

    Que hablen los gráficos...

    Dime cuanto colocará Facebook y te digo en qué punto del ciclo bursátil estamos

    Evolución del S&P 500 y las mayores salidas a Bolsa en EEUU (B= miles millones USD)

    Comprar o mantener, nunca vender!

    Un ejemplo del seguidismo que tanto gusta a los Lemmings....   

    Desde PragCap 

    I always have a good chuckle when I look at analyst’s ratings on the broad market. I got an even better chuckle when I read this story from FactSet:
    “Despite a 4.4% increase in the price of the S&P 500 over the past month, analysts have become more pessimistic on the market based on changes to their ratings since January 1. While the number of Buy ratings dipped slightly (-0.5%), the number of Hold ratings rose 6.3% and the number of Sell ratings jumped 13.2% during the month.
    Overall, 52% of the ratings on companies in the S&P 500 were Buy ratings, 43% of the ratings were Hold ratings, and 5% of the ratings were Sell ratings. At the sector level, the Energy sector has the highest percentage of Buy ratings (64%), while the Utilities sector has the lowest percentage of Buy ratings (31%).”
    Yes, can you feel the pessimism? That’s a whopping 1% rise in the number of sell calls. It never ceases to amaze me. I know how the Wall Street machine works and they need you in the game, but it drives me mad how analysts will always tell you when to get into a stock, but never have an exit strategy. I’ve made most of my money in stocks over the years by being a great seller. I’m a mediocre buyer. But I’m a great seller. I don’t know how any good investor can have one side of the coin without the other. And more often than not, I find that the people who are the greatest investors don’t just have an entrance strategy, but have the exit strategy mastered….

    martes, 14 de febrero de 2012

    Feliz día de San Valentín!!

    ¿Un sell off en mercados para esperar más QE?

    Desde Socite Generale (vía PragCap):
    “QE3 has been delayed by the recent bout of good news from the US economy: SG is now in line with the consensus, expecting the launch in Q2 (24-25 April FOMC meeting).
    As the $400bn Operation Twist program is still boosting demand for long-dated US Treasuries, we believe the Fed will be concentrating its expected $600bn QE3 on buying mortgage products to provide support to the underlying property market.
    While policy loosening can but be good for all financial assets, the market impact should be less strong than during QE1 or QE2, as the surprise effect has disappeared.
    QE1 and QE2 were launched at a time when the US Economic Surprise Indicator (ESI) was
    very low. This time, the ESI has moved back up to an all-time high, indicating that the consensus on the economy may have become too optimistic and thus possibly putting risk assets in danger in the near future.”

    lunes, 13 de febrero de 2012

    Alerta naranja en EuroStoxx

    Desde Analistas Financieros Internacionales:

    Las señales de compra (verde) de agosto septiembre comienzan a madurar...
    ...la alerta es naranja (rojo señal de venta), pero podría ser suficiente para esperar una corrección notable a corto plazo.

    El juego de la patata caliente

    En su último semanal (aquí), Hussman expone muy bien el síndrome del "hot potato"...

    "We've seen little during this period but the effect of a hot potato being repeatedly passed from speculatively overvalued, overbought, overbullish market conditions driven by massive central bank interventions, to credit strains and emerging economic weakness nearly the instant those interventions are even temporarily suspended. As a result, by turns we've seen the repeated emergence of the same speculative "Aunt Minnies" that have historically accompanied major and intermediate market peaks, followed by the emergence of credit strains, economic pressures, and a flight to safe-havens. This alternation is certainly not typical of market history. Nor is it typical of a complete market cycle or business cycle. As unsatisfactory as it may be, the market is presently in an extended game of hot potato which will be resolved by the eventual removal of both conditions."By John P. Hussman, Ph.D.
    President, Hussman Investment Trust

    Grecia: Deja Vú

    Desde BusinessInsider:

    Greece needs money by next month. The troika makes demands it has to meet. Greek leaders resist and make some bold moves, fearing the domestic backlash to austerity. EU leaders bear down on their demands, and Greece grudgingly laments.
    Sound familiar? If the fallout from former PM George Papandreou's referendum proposal in November is any indication, then this is the exact series of events we're seeing playing out in Greece right now.
    And in fact, changes in the price of the euro versus the dollar would suggest that the Greek budget drama really is just a repeat of what we saw a few months ago—eerily so in fact. A few months ago, the euro gained steadily against the dollar after a crucial EU summit, but tanked sharply after Papandreou announced that Greece would hold a referendum on unpopular austerity measures. Papandreou finally gave into European demands, withdrew the referendum proposal, and said he would step down as prime minister, but it took a long time for the euro to recover after that.
    While there are many reasons the euro might have been on the rise since early January, is that rally about to come to a close? See the striking similarities between September-November (red) and December to now (green):
    greece eurusd deja vu

    Beware of a "Flash Crash"

    Desde safehaven:

    Something big is about to happen

    Beware of a "Flash Crash"!
    If the following two charts don't frighten you, then nothing from a technical analysis perspective likely will.

    MARGIN HAS COLLAPSED - TRIGGER$ POINT


    SHORT INTEREST HAS BEEN CRUSHED - TRIGGER$ POINT
    According to the latest data, short interest has plummeted from a multi-year high in September of 16 billion shorts, which coincided with the market lows, to essentially the lowest print seen in the past 4 years at 12.5 billion shares. Players who look at short interest and covering as a market inflection point, see this as the signal for a market rolling over.


    Something big is about to happen.

    Papá oso, mamá oso y bebé oso

    Fantástico informe de Crestmont Research (aquí)

    domingo, 12 de febrero de 2012

    LIVE COVERAGE: GREECE VOTING ON AUSTERITY

    En Busines Insider

    Investor Sentiment: Heading Into the Final Stages

    Guy Lerner en Safehaven.com (enlace)

    As long as the bulls continue to believe, the market should continue to push higher, but there will be a limit. Clearly, the best, most accelerated gains are behind us, and from this point onward, the gains will be harder to come by. Investors should have been buying back here (see article from October 7, 2011) when risks were perceived to be high. Instead, investors are buying now when there is a belief that the market is a sure thing. Sure things and market profits are normally not found in the same sentence. Nonetheless and as stated last week, I would embrace the current bullishness, but be aware that signs of a market top are starting to crop up. For example, the depth and duration of market sell offs has become very brief as investors feel like they are missing out. Or company insiders have increased their selling significantly. The best thing the market can do is sell off and take the "weak hands" out of their positions, but that doesn't seem to be in the cards.
    The "Dumb Money" indicator (see figure 1) looks for extremes in the data from 4 different groups of investors who historically have been wrong on the market: 1) Investors Intelligence; 2) MarketVane; 3) American Association of Individual Investors; and 4) the put call ratio. This indicator shows extreme bullishness.
    Figure 1. "Dumb Money"/ weekly
    Dumb Money Weekly
    Figure 2 is a weekly chart of the SP500 with the InsiderScore "entire market" value in the lower panel. From the InsiderScore weekly report: "Insider selling increased last week as a big wave of insiders saw trading windows open and were free to trade following their companies' earnings announcements. Selling has not reached a level that has triggered any major red flags quantitatively or qualitatively."
    Figure 2. InsiderScore "Entire Market" value/ weekly
    InsiderScore Entire Market Value Weekly
    Figure 3 is a weekly chart of the SP500. The indicator in the lower panel measures all the assets in the Rydex bullish oriented equity funds divided by the sum of assets in the bullish oriented equity funds plus the assets in the bearish oriented equity funds. When the indicator is green, the value is low and there is fear in the market; this is where market bottoms are forged. When the indicator is red, there is complacency in the market. There are too many bulls and this is when market advances stall. Currently, the value of the indicator is 69.14%. Values less than 50% are associated with market bottoms. Values greater than 58% are associated with market tops.
    Figure 3. Rydex Total Bull v. Total Bear/ weekly
    Rydex Total Bull versus Total Bear Weekly

    ¿Qué está pasando en Grecia?

    En twitter:
    @LoomingLemming

    La reforma del mercado laboral en España: Sala i Martín vs FEDEA

    Comentarios Sala i Martín:


    "la idea de unas indemnizaciones menores es que los empresarios no contrataban a nuevos trabajadores por miedo a los costes de tener que despedirlos. La reducción del coste de despido puede incentivar a los empresarios a arriesgarse a contratar nuevos trabajadores porque el riesgo de equivocarse es ahora menor. La reducción de la indemnización de 33 a 22 días por año trabajado y la reducción del tope de 42 mensualidades es una reducción de los costes de despido aunque espero que eso no fuera a lo que se refería De Guindos cuando dijo a micrófono cerrado que la reforma sería "extraordinariamente agresiva"!

    Me parece particularmente buena la idea de reducir la indemnización en caso de que la empresa vaya mal. Miles de empresas han tenido que cerrar en los últimos años porque era más barato quebrar (o hacer concurso de acreedores) que despedir a trabajadores, cosa que ha agravado la crisis.
    Dicho esto, creo que se tendría que legislar con mucha mayor precisión la definición de " la empresa va mal". La magia de la contabilidad creativa y la fungibilidad de los pagos hará que cuando una empresa quiera despedir a gente y pagar solo 20 días, simplemente "fabrique" una reducción contable de ventas o unas pérdidas contables con una total indefensión por parte de los trabajadores. Por otro lado, si no está clara la definición y estimación del concepto, los despidos acabarán en los tribunales y éstos siempre han sido el gran problema del empresario a la hora de ajustar plantillas. Es muy importante que este punto se haga bien porque si no, los empresarios nunca van a poder ajustar plantillas en momento de crisis y este punto será una buena declaración de intenciones que acaba siendo completamente inútil porque nunca se utiliza (los empresarios preferirán, como ha pasado hasta hoy, el despido improcedente que es más caro pero que no comporta ni gastos ni dolores de cabeza judiciales)"
    Más en el enlace

    Desde Fedea:

    En fin, tardaremos semanas en saber que tal es realmetne la reforma, pero de momento, creo que mi evaluación preliminar es positiva. ¿Qué falta?
    Cuatro cosas, que se pueden y deben aun ahacer en trámite parlamentario
    1)     simplificar el número de contratos REDUCIENDO LOS CONTRATOS TEMPORALES
    2)     una indemnización por despido creciente en los contratos indefinidos hasta llegar a los 20/33 días
    3)     una transición al sistema austriaco de despido.
    4)     una forma de favorecer la reducción de jornada
    ¡Ah! Y una cosa más: Mucha más pedagogía. Si el gobierno no es capaz de explicar esto, los trabajadores y los empresarios no lo van a entender, y vamos a ver solo despidos, no flexibilidad interna.
    Comentario completo, aquí